Remote Debugging
The debugging tools GDB and Clouseau are most commonly used to debug an application locally, but can also be used remotely in order to debug a program running on one system using a different system entirely. This can be vital for debugging issues which result in display corruption or loss of user input capabilities on the host device.
This document aims to provide a brief overview of the server capabilities available for remote debugging using these two tools. You will need an SSH server running on the system to be debugged, and an SSH client on the system you are controlling.
GDB Server
Information on debugging local programs with the GNU Debugger (GDB) can be found in Debugging with GDB. The GNU Debugger Server gdbserver is a control program for Unix-like systems which allows you to connect your program with a remote gdb via target remote but without linking in the usual debugging stub.
gdbserver is not a complete replacement for the debugging stubs because it requires essentially the same operating-system facilities that gdb itself does. In fact, a system that can run gdbserver to connect to a remote gdb could also run gdb locally. gdbserver is nevertheless sometimes useful because it is a much smaller program than gdb itself. It is also easier to port than all of gdb, so you may be able to get started more quickly on a new system by using gdbserver. Finally, if you develop code for real-time systems, you may find that the trade-offs involved in real-time operation make it more convenient to do as much development work as possible on another system, for example by cross-compiling. You can use gdbserver to make a similar choice for debugging.
gdb and gdbserver communicate via either a serial line or a TCP connection, using the standard GDB remote serial protocol.
NOTE:
gdbserverdoes not have any security built-in. Do not rungdbserverwhile connected to any public network. Agdbconnection togdbserverprovides access to the target system with the same privileges as the user runninggdbserver.
Remote Debugging with GDB
Install gdbserver on your target system, then create and compile the "helloworld.c" program from Debugging with GDB.
Run the "helloworld" binary through gdbserver:
#target
gdbserver localhost:2000 helloworld
$ Process helloworld created; pid = 2763
$ Listening on port 2000
At this point gdbserver is waiting for a connection on port 2000 of the target system.
NOTE: The GNU Debugger can be launched as multiple processes using
gdbserver --multi localhost:2000.
Run gdb on your local client machine and use target remote to connect to the target system, replacing [target-ip] with the IP address of the target system.
#client
gdb
(gdb)  target remote [target-ip]:2000
$ Remote debugging using [target-ip]:2000
$ Reading symbols from /lib64/ld-linux-x86-64.so.2...Reading symbols from
$ /usr/lib/debug//lib/x86_64-linux-gnu/ld-2.19.so...done.
$ done.
$ Loaded symbols for /lib64/ld-linux-x86-64.so.2
$ 0x00007ffff7ddb2d0 in _start () from /lib64/ld-linux-x86-64.so.2
At this point you can add breakpoints or carry out other debugging tasks. Note, however, that if you continue the program's execution the output will display on the target system, not your local client.
#client
(gdb) continue
Return to the target system and click the "seg" button to trigger the segmentation fault condition. When the program crashes, the traces will appear on the local client system:
$ Program received signal SIGSEGV, Segmentation fault.
$ 0x0000000000400b71 in ?? ()
You can now use the GNU Debugger as demonstrated in Debugging with GDB, for example by printing a backtrace:
(gdb) bt
$ 0  0x0000000000400b71 in ?? ()
$ 1  0x000000000073a9a0 in ?? ()
$ 2  0x00007ffff74e4f6c in _eo_evas_smart_cb (data=<optimized out>, eo_obj=<optimized out>, desc=<optimized out>, event_info=<optimized out>) at lib/evas/canvas/evas_object_smart.c:65
$ 3  0x00007ffff561a8b7 in _eo_base_event_callback_call (obj_id=0x80000007e0000040, pd=0x73a3f0, desc=0x85d4c0, event_info=0x0) at lib/eo/eo_base_class.c:712
$ 4  0x00007ffff5619648 in eo_event_callback_call (desc=desc@entry=0x85d4c0, event_info=event_info@entry=0x0) at lib/eo/eo_base.eo.c:94
$ 5  0x00007ffff74e6f6e in evas_object_smart_callback_call (eo_obj=eo_obj@entry=0x80000007e0000040, event=event@entry=0x7ffff7af501f <SIG_CLICKED> "clicked", event_info=event_info@entry=0x0) at lib/evas/canvas/evas_object_smart.c:784
$ 6  0x00007ffff7995baf in _activate (obj=0x80000007e0000040) at elm_button.c:69
$ 7  0x00007ffff7995be5 in _on_clicked_signal (data=<optimized out>, obj=<optimized out>, emission=<optimized out>, source=<optimized out>) at elm_button.c:191
$ 8  0x00007ffff58b0507 in edje_match_callback_exec_check_finals (prop=<optimized out>, ed=0xaaaaaaaaaaaaaaab, source=0x7245b0 "elm", sig=0x73af9c "elm,action,click", source_states=<optimized out>, signal_states=<optimized out>, matches=0x73b0c0, ssp=0x7594e0) at lib/edje/edje_match.c:556
$ 9  edje_match_callback_exec (ssp=ssp@entry=0x7594e0, matches=0x73b0c0, sig=sig@entry=0x73af9c "elm,action,click", source=source@entry=0x7245b0 "elm", ed=ed@entry=0x73a9a0, prop=prop@entry=0 '\000') at lib/edje/edje_match.c:711
$ 10 0x00007ffff58b6a3d in _edje_emit_cb (prop=0 '\000', data=0x0, src=0x7245b0 "elm", sig=0x73af9c "elm,action,click", ed=0x73a9a0) at lib/edje/edje_program.c:1423
$ 11 _edje_emit_handle (ed=0x73a9a0, sig=0x73af9c "elm,action,click", src=0x7245b0 "elm", sdata=0x0, prop=0 '\000') at lib/edje/edje_program.c:1376
$ 12 0x00007ffff58b13a1 in _edje_message_process (em=0x667830) at lib/edje/edje_message_queue.c:684
$ 13 0x00007ffff58b18b3 in _edje_message_queue_process () at lib/edje/edje_message_queue.c:787
$ 14 0x00007ffff58b1a14 in _edje_job (data=<optimized out>) at lib/edje/edje_message_queue.c:154
$ 15 0x00007ffff7235a32 in _ecore_job_event_handler (data=<optimized out>, type=<optimized out>, ev=<optimized out>) at lib/ecore/ecore_job.c:121
$ 16 0x00007ffff7230463 in _ecore_call_handler_cb (event=<optimized out>, type=<optimized out>, data=<optimized out>, func=<optimized out>) at lib/ecore/ecore_private.h:386
$ 17 _ecore_event_call () at lib/ecore/ecore_events.c:565
$ 18 0x00007ffff7237e05 in _ecore_main_loop_iterate_internal (once_only=once_only@entry=0) at lib/ecore/ecore_main.c:1927
$ 19 0x00007ffff7237f14 in ecore_main_loop_begin () at lib/ecore/ecore_main.c:983
$ 20 0x00007ffff7a47e59 in elm_run () at elm_main.c:1097
Clouseau Server
Designed for inspecting EFL user interfaces, Clouseau can be used locally as well as remotely. Information on using Clouseau locally can be found in Debugging with Clouseau.
Clouseau consists of a client, clouseau_client, and launcher, clouseau_server. This design means you can run the application requiring debugging on one device and the clouseau_client itself on another. In this it is very similar to gdbserver.
Remote Debugging with Clouseau
On your target system, launch the Clouseau server with the application to be debugged:
clouseau_start ./your_applicationOn your local client connect to the target system with the following command, replacing [target-ip] with its IP address:
clouseau_client [target-ip]Alternatively, you can connect via Clouseau's user interface as demonstrated in the following screenshot:
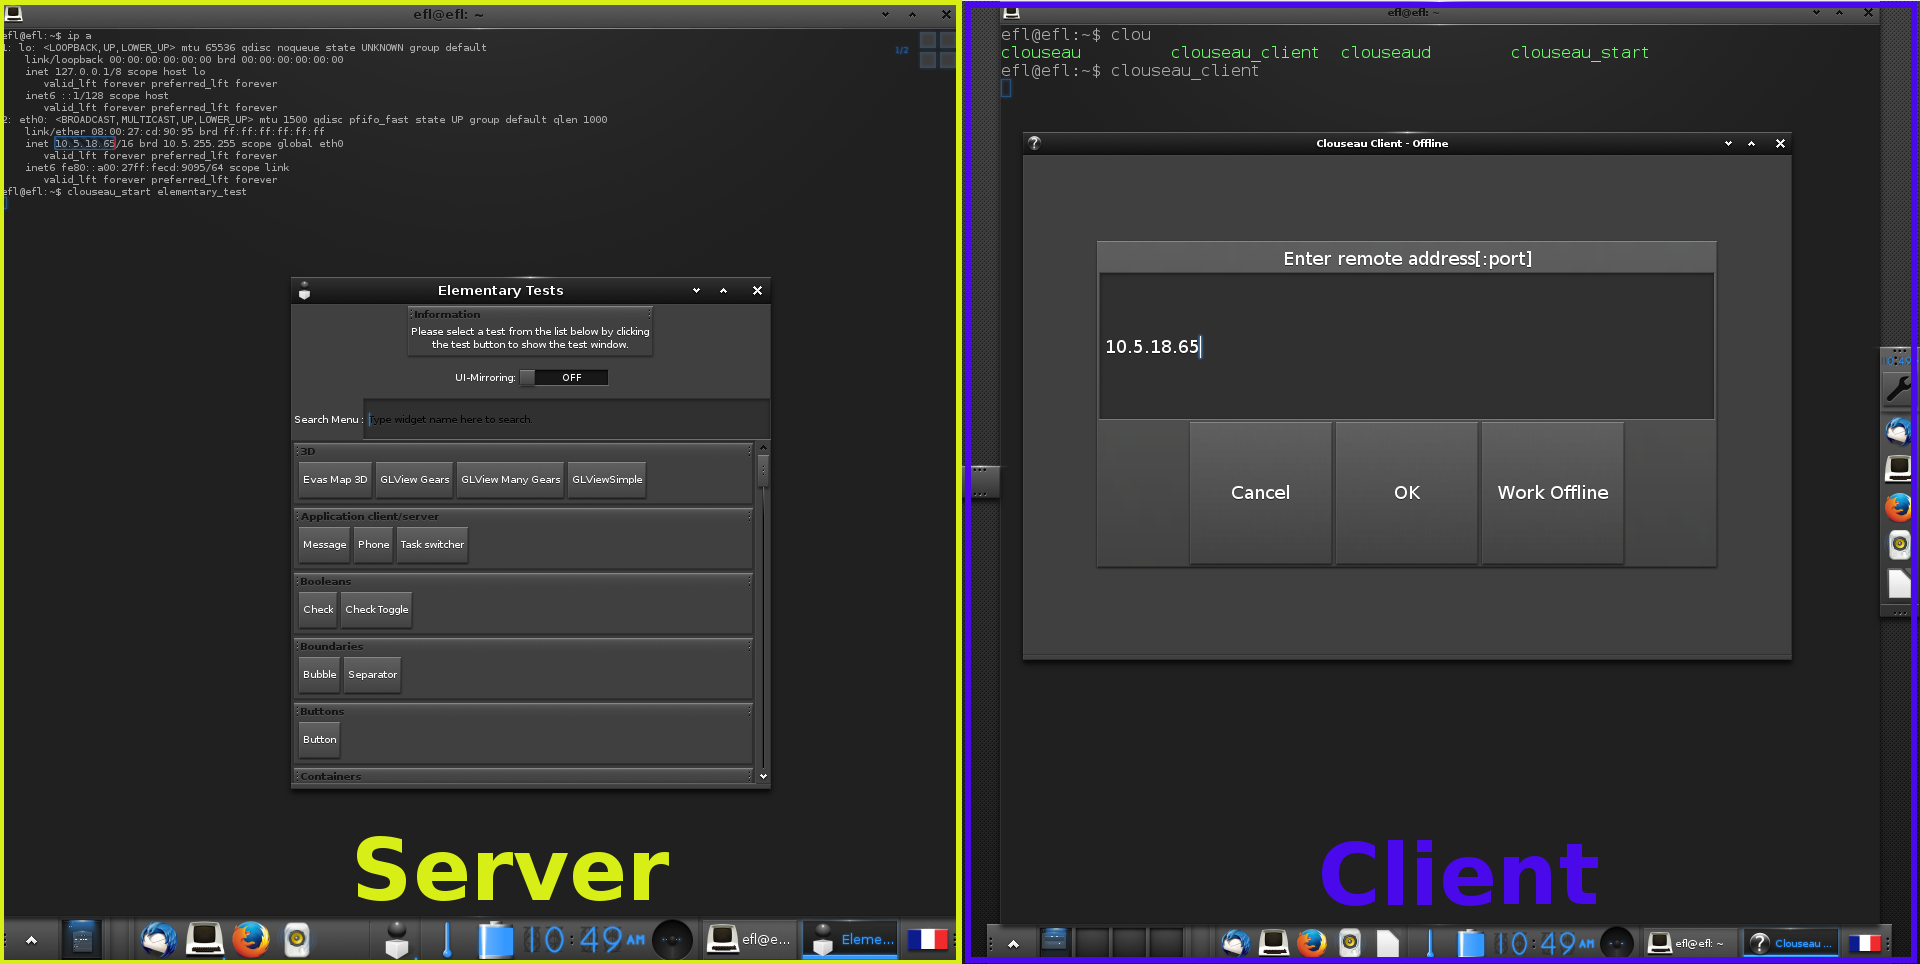
From here use Clouseau as per Debugging with Clouseau.